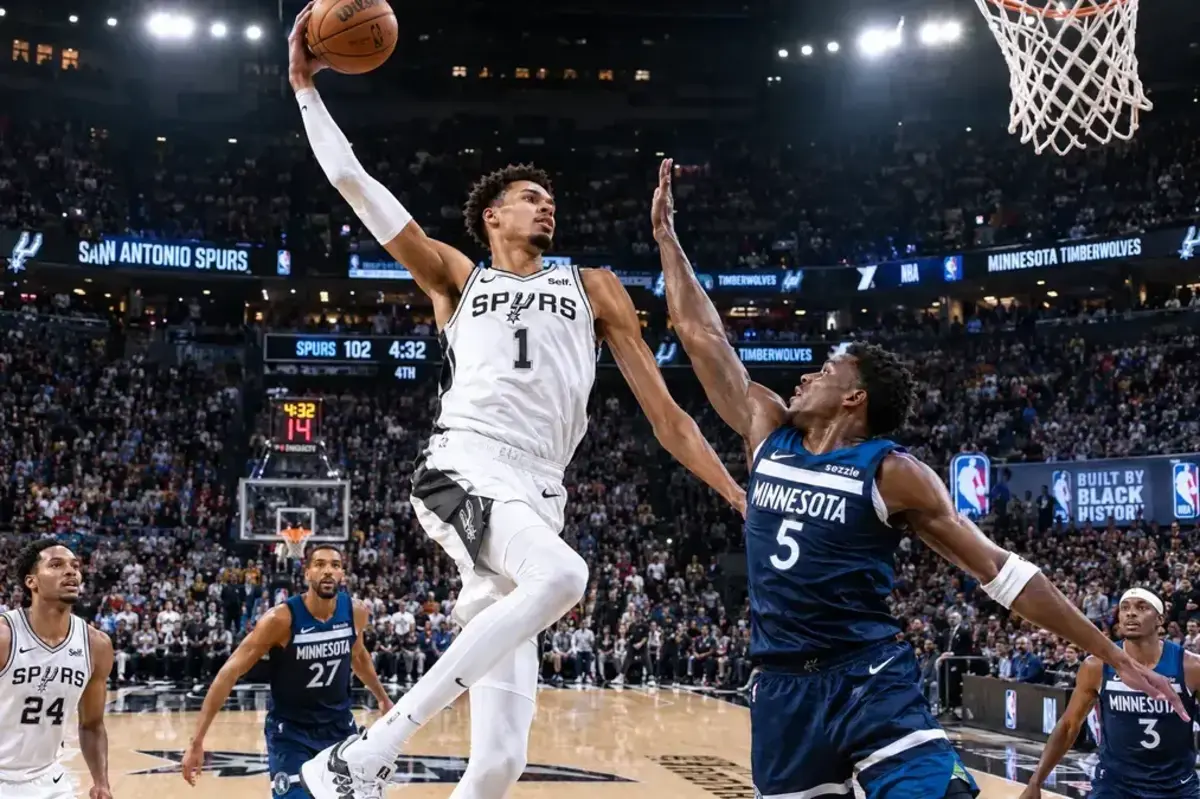
Sifting through a basic box score rarely tells the whole story of why a close NBA game slips away in the final minutes. Fans often miss the subtle shifts in transition defense and second-chance opportunities that actually dictate the final outcome. Analyzing the complete san antonio spurs vs timberwolves stats breaks down the exact shooting splits, turnover differentials, and defensive stops that decided this Western Conference matchup.
On February 27, 2024, the Minnesota Timberwolves hosted the San Antonio Spurs at Target Center in Minneapolis, Minnesota. Playing in front of a capacity crowd of 18,024, the Timberwolves earned a 114-105 victory, repelling a determined fourth-quarter comeback attempt by San Antonio.
Reviewing the san antonio spurs vs timberwolves stats highlights how Minnesota utilized balanced interior rim protection alongside dynamic perimeter scoring. Anthony Edwards guided the offensive attack late in the fourth quarter, while Rudy Gobert dominated the boards to help Minnesota maintain their position near the top of the Western Conference standings.
Match Overview Table
| Information | Match Details |
| Event | NBA Regular Season |
| Game | San Antonio Spurs vs. Minnesota Timberwolves |
| Date | February 27, 2024 |
| Venue | Target Center (Minneapolis, MN) |
| Attendance | 18,024 |
| Winner | Minnesota Timberwolves |
| Final Score | 114 – 105 |
| Broadcast | Bally Sports North, KENS 5, NBA League Pass |
Core Match Statistics Overview
A thorough review of the team san antonio spurs vs timberwolves stats underscores key tactical disparities across shooting accuracy, ball protection, and fast-break production.
| Team Statistic | San Antonio Spurs | Minnesota Timberwolves |
| Field Goals Made / Attempted | 39/89 | 42/91 |
| Field Goal Percentage (%) | 43.8% | 46.2% |
| 3-Point FG Made / Attempted | 12/37 | 13/33 |
| 3-Point FG Percentage (%) | 32.4% | 39.4% |
| Free Throws Made / Attempted | 15/19 | 17/23 |
| Free Throw Percentage (%) | 78.9% | 73.9% |
| Offensive Rebounds | 10 | 12 |
| Total Rebounds | 41 | 47 |
| Assists | 26 | 28 |
| Turnovers | 16 | 12 |
| Steals | 7 | 10 |
| Blocks | 6 | 7 |
| Points in the Paint | 48 | 54 |
| Fast Break Points | 14 | 19 |
Three-Point Accuracy Gap
Minnesota converted 39.4% of their perimeter attempts, knocking down 13 shots from beyond the arc to punish San Antonio’s drop coverage.
San Antonio managed just 32.4% from distance, missing 25 of their 37 attempts and struggling to create clean corner looks against Minnesota’s rotating defense.
Defensive Glass Control
The Timberwolves collected 35 defensive rebounds, limiting the Spurs to only 10 second-chance opportunities across four quarters.
Rudy Gobert set the physical tone inside, pulling down 17 total boards to eliminate putback chances for San Antonio’s frontcourt.
Turnover Conversion Differentials
San Antonio gave away 16 turnovers, which Minnesota converted into 22 transition points on the other end.
Active perimeter hands from Minnesota guards disrupted San Antonio’s high pick-and-roll passing reads throughout the first half.
Points in the Paint Battle
Minnesota held a 54-48 scoring advantage inside the lane by consistently attacking gaps when Victor Wembanyama rotated away from the rim.
Despite Wembanyama’s four blocks, Minnesota’s guards finished through contact on direct downhill drives.
Period-by-Period Analysis
First Quarter Breakdown
| Team | Q1 Points | FG% | 3PT% | Rebounds | Turnovers |
| San Antonio Spurs | 21 | 38.1% | 25.0% | 9 | 5 |
| Minnesota Timberwolves | 29 | 50.0% | 42.9% | 13 | 3 |
Minnesota set the pace immediately by attacking the paint and creating early corner three-point looks for an 8-point lead.
San Antonio coughed up 5 early turnovers against aggressive on-ball traps along the sideline.
Victor Wembanyama scored 6 quick points, but the Spurs struggled to generate secondary scoring options early.
Second Quarter Breakdown
| Team | Q2 Points | FG% | 3PT% | Rebounds | Turnovers |
| San Antonio Spurs | 22 | 40.9% | 30.0% | 10 | 4 |
| Minnesota Timberwolves | 29 | 47.6% | 37.5% | 12 | 2 |
- Naz Reid provided an offensive spark off the bench for Minnesota, scoring 10 points in the frame with perimeter shooting.
- San Antonio found success in transition through Devin Vassell, though their half-court spacing remained congested.
- Minnesota expanded their advantage to 58-43 heading into the halftime break behind disciplined defensive positioning.
- Third Quarter Breakdown
| Team | Q3 Points | FG% | 3PT% | Rebounds | Turnovers |
| San Antonio Spurs | 24 | 45.0% | 33.3% | 11 | 4 |
| Minnesota Timberwolves | 25 | 42.9% | 33.3% | 11 | 4 |
San Antonio tightened their interior defensive coverage, holding Minnesota to 42.9% shooting during the third frame.
Karl-Anthony Towns converted consecutive high-post jumpers to steady Minnesota’s offense against San Antonio’s zone looks.
The Spurs won the physical battle inside during the final four minutes of the period to keep the deficit manageable.
Fourth Quarter Breakdown
| Team | Q4 Points | FG% | 3PT% | Rebounds | Turnovers |
| San Antonio Spurs | 38 | 50.0% | 40.0% | 11 | 3 |
| Minnesota Timberwolves | 31 | 45.5% | 44.4% | 11 | 3 |
- San Antonio exploded for 38 points in the final frame, using a 14-4 run engineered by Keldon Johnson and Devin Vassell to cut the deficit to single digits.
- Anthony Edwards answered the Spurs push by scoring 12 points in the fourth quarter on isolation drives and step-back jumpers.
- Minnesota made key defensive stops over the final two minutes to secure the nine-point victory.
Detailed Team Player Statistics
A deeper breakdown of the individual san antonio spurs vs timberwolves stats illustrates the scoring load carried by each team’s primary offensive options.
San Antonio Spurs Player Statistics
| Player | MIN | PTS | REB | AST | STL | BLK | FG | 3PT | FT |
| Devin Vassell | 36 | 21 | 6 | 6 | 1 | 0 | 9-18 | 2-7 | 1-2 |
| Keldon Johnson | 31 | 20 | 6 | 4 | 0 | 0 | 7-14 | 3-7 | 3-3 |
| Victor Wembanyama | 34 | 17 | 13 | 5 | 2 | 4 | 5-13 | 2-7 | 5-5 |
| Jeremy Sochan | 30 | 13 | 8 | 2 | 1 | 0 | 6-11 | 1-3 | 0-0 |
Devin Vassell: Vassell generated 21 points and distributed 6 assists, acting as San Antonio’s primary playmaker in late-clock situations. His mid-range pull-up jumpers helped spark the Spurs fourth-quarter comeback attempt.
Keldon Johnson: Johnson scored 20 points off the bench, driving into the heart of Minnesota’s defense and drawing contact. His physical finishes kept San Antonio within striking distance down the stretch.
Victor Wembanyama: Wembanyama delivered a complete stat line with 17 points, 13 rebounds, 5 assists, and 4 blocks. His presence altered countless Minnesota interior attempts throughout his 34 minutes on the floor.
Jeremy Sochan: Sochan added 13 points and 8 rebounds while defending multiple frontcourt assignments against Towns and Reid.
Minnesota Timberwolves Player Statistics
| Player | MIN | PTS | REB | AST | STL | BLK | FG | 3PT | FT |
| Anthony Edwards | 38 | 34 | 5 | 5 | 4 | 1 | 12-29 | 3-8 | 7-8 |
| Naz Reid | 29 | 22 | 6 | 1 | 0 | 1 | 8-10 | 4-5 | 2-2 |
| Karl-Anthony Towns | 32 | 17 | 7 | 2 | 1 | 0 | 7-12 | 1-3 | 2-3 |
| Rudy Gobert | 37 | 13 | 17 | 3 | 1 | 4 | 5-7 | 0-0 | 3-6 |
- Anthony Edwards: Edwards led all scorers with 34 points, adding 5 rebounds, 5 assists, and 4 steals to anchor Minnesota’s perimeter attack. He took control of the offense in the fourth quarter to prevent San Antonio from taking the lead.
- Naz Reid: Reid supplied 22 points on 8-of-10 shooting from the floor, including 4-of-5 from three-point range. His perimeter scoring forced San Antonio’s rim protectors away from the paint.
- Karl-Anthony Towns: Towns produced 17 points and 7 rebounds, scoring from the mid-post and moving the ball against double teams.
- Rudy Gobert: Gobert anchored the lane with 13 points, 17 rebounds, and 4 blocks while shooting 5-of-7 from the field.
Statistical Leaders Summary Table
The comparative san antonio spurs vs timberwolves stats highlight the top performers across each primary statistical category:
| Category | San Antonio Spurs | Minnesota Timberwolves |
| Leading Scorer | Devin Vassell (21 PTS) | Anthony Edwards (34 PTS) |
| Second Leading Scorer | Keldon Johnson (20 PTS) | Naz Reid (22 PTS) |
| Top Rebounder | Victor Wembanyama (13 REB) | Rudy Gobert (17 REB) |
| Top Playmaker | Devin Vassell (6 AST) | Anthony Edwards (5 AST) |
| Shot Blocker | Victor Wembanyama (4 BLK) | Rudy Gobert (4 BLK) |
| Steals Leader | Victor Wembanyama (2 STL) | Anthony Edwards (4 STL) |
Analytical Breakdowns (“Why They Won / Why They Lost”)
Dissecting the san antonio spurs vs timberwolves stats from an efficiency standpoint reveals the tactical reasons behind the final score.
Why Minnesota Won
Efficient Bench Production
Minnesota’s bench provided a substantial scoring lift, outscoring San Antonio’s reserves behind an efficient shooting display.
| Bench Comparison | San Antonio Spurs | Minnesota Timberwolves |
| Bench Points | 28 | 38 |
| Bench Field Goal % | 41.6% | 58.3% |
| Bench 3-Point FG Made | 4 | 6 |
- Naz Reid’s individual output stretched San Antonio’s defense, opening up passing lanes for cutters when the Spurs collapsed into the lane.
- Interior Rebounding and Second-Chance Denial
- Minnesota limited San Antonio’s opportunities on the offensive glass by securing defensive rebounds and ending possessions immediately.
| Rebound Metrics | San Antonio Spurs | Minnesota Timberwolves |
| Defensive Rebounds | 31 | 35 |
| Offensive Rebounds Allowed | 12 | 10 |
| Total Rebound Margin | -6 | +6 |
- Rudy Gobert’s 17 rebounds gave Minnesota the platform to dictate the physical flow of the game without giving up second-chance putbacks.
- Late-Game Shot Creation by Anthony Edwards
- When San Antonio narrowed the deficit to single digits, Edwards stepped forward with direct isolation scoring. He attacked single coverage, made mid-range step-backs, and drew contact to earn trips to the free throw line.
- Why San Antonio Lost
- Costly Turnovers in Transition
- San Antonio struggled to protect the basketball, committing 16 turnovers that gave Minnesota easy transition scoring opportunities.
| Turnover & Transition Metrics | San Antonio Spurs | Minnesota Timberwolves |
| Total Turnovers Committed | 16 | 12 |
| Points Conceded Off Turnovers | 22 | 11 |
| Fast Break Points Conceded | 19 | 14 |
The 22 points surrendered off giveaways neutralized the offensive gains San Antonio made during their fourth-quarter run.
Cold Perimeter Shooting Stretches
The Spurs connected on just 12 of their 37 three-point attempts (32.4%). Missing 25 shots from outside allowed Minnesota’s defense to crowd the paint and challenge drivers at the rim.
Historical Context & Advanced Insights
Season Series Breakdown
| Date | Venue | Result | High Scorer | Defining Metric |
| Nov 10, 2023 | Frost Bank Center | MIN 117, SAS 110 | Towns (29 PTS) | MIN 52.0% FG |
| Jan 27, 2024 | Frost Bank Center | SAS 113, MIN 112 | Vassell (25 PTS) | SAS 4th-Qtr Defense |
| Feb 27, 2024 | Target Center | MIN 114, SAS 105 | Edwards (34 PTS) | MIN 38 Bench PTS |
Advanced Statistical Insights
Evaluating the advanced san antonio spurs vs timberwolves stats demonstrates how possession management decided the night:
True Shooting Percentage (TS%): Minnesota finished with a 56.8% True Shooting mark compared to 52.4% for San Antonio, reflecting Minnesota’s higher efficiency on three-point shots and free throws.
Assist Ratio: San Antonio assisted on 66.7% of their made baskets (26 assists on 39 field goals), while Minnesota matched that rate with 28 assists on 42 field goals. Minnesota’s ball movement created higher-percentage looks around the basket.
Offensive Rating: Minnesota posted an Offensive Rating of 115.2 points scored per 100 possessions, outperforming San Antonio’s mark of 106.1.
Pace: The contest was played at a pace of 97.4 possessions, fitting Minnesota’s preferred tempo of disciplined half-court defense.
Game Implications & Key Lessons
What This Means for the Timberwolves
Minnesota maintains their position near the top of the Western Conference standings by closing out games against energetic younger teams.
Anthony Edwards continues to establish himself as a primary late-game option during tight fourth-quarter scenarios.
Naz Reid’s scoring off the bench gives Minnesota tactical flexibility against teams that pack the paint.
What This Means for the Spurs
San Antonio shows offensive growth behind Devin Vassell and Victor Wembanyama, but late-game execution remains an area for improvement.
Limiting live-ball turnovers is required if the Spurs are to turn competitive fourth quarters into road victories.
Wembanyama’s rim protection remains a foundational asset that alters opponents’ offensive shot charts.
Key Matchup Lessons
High-percentage perimeter shooting punishes defensive schemes that pack the paint.
Securing the defensive glass prevents opponents from extending possessions and building momentum.
Bench scoring differentials frequently decide regular-season games when starters play to a draw.
Live-ball giveaways produce high-efficiency transition opportunities that undermine defensive structure.
Isolating dynamic scorers against single coverage in the fourth quarter remains a reliable closing strategy.
Final Game Summary
Ultimately, the official san antonio spurs vs timberwolves stats demonstrate that Minnesota’s shot discipline and interior rebounding edge were enough to offset San Antonio’s late 38-point fourth-quarter push. While Devin Vassell and Victor Wembanyama kept the Spurs competitive, San Antonio’s 16 turnovers and 32.4% perimeter shooting left them chasing the lead for most of the night. Behind Anthony Edwards’ 34 points